In addition to published reports, the GMU-NED Project has developed a number of interactive tools to explore the underlying data in more depth.
GMU NONPROFIT WORKS. Launched in February 2025, the GMU-Nonprofit Works Data Explorer allows users to easily search and download the latest available data on nonprofit employment, establishments, and weekly and annual average wages on the national, state, county, and MSA levels by field and compare nonprofits to for-profits and government over the full period. Data are currently available at the state and county level for the years 1990-2022. National data are available beginning in 2007, and MSA data are available beginning in 2013. Click here to explore Nonprofit Works.
NONPROFIT EMPLOYMENT IN THE STATES, 2017-2022. This dashboard supplements the GMU-NED’s Nonprofit Employment in the States, 2017-2022 report. That report examines overall nonprofit employment and wages in all 50 states, the District of Columbia, Puerto Rico, and the U.S. Virgin Islands as of 2022, with a special focus on how nonprofits fared during and immediately following the acute COVID-19 period in comparison to for-profit counterparts. This dashboard provides further detail on nonprofit employment and wages broken down by field of activity over the same period. Click here to explore the Nonprofit Employment in the States, 2017-2022 dashboard.
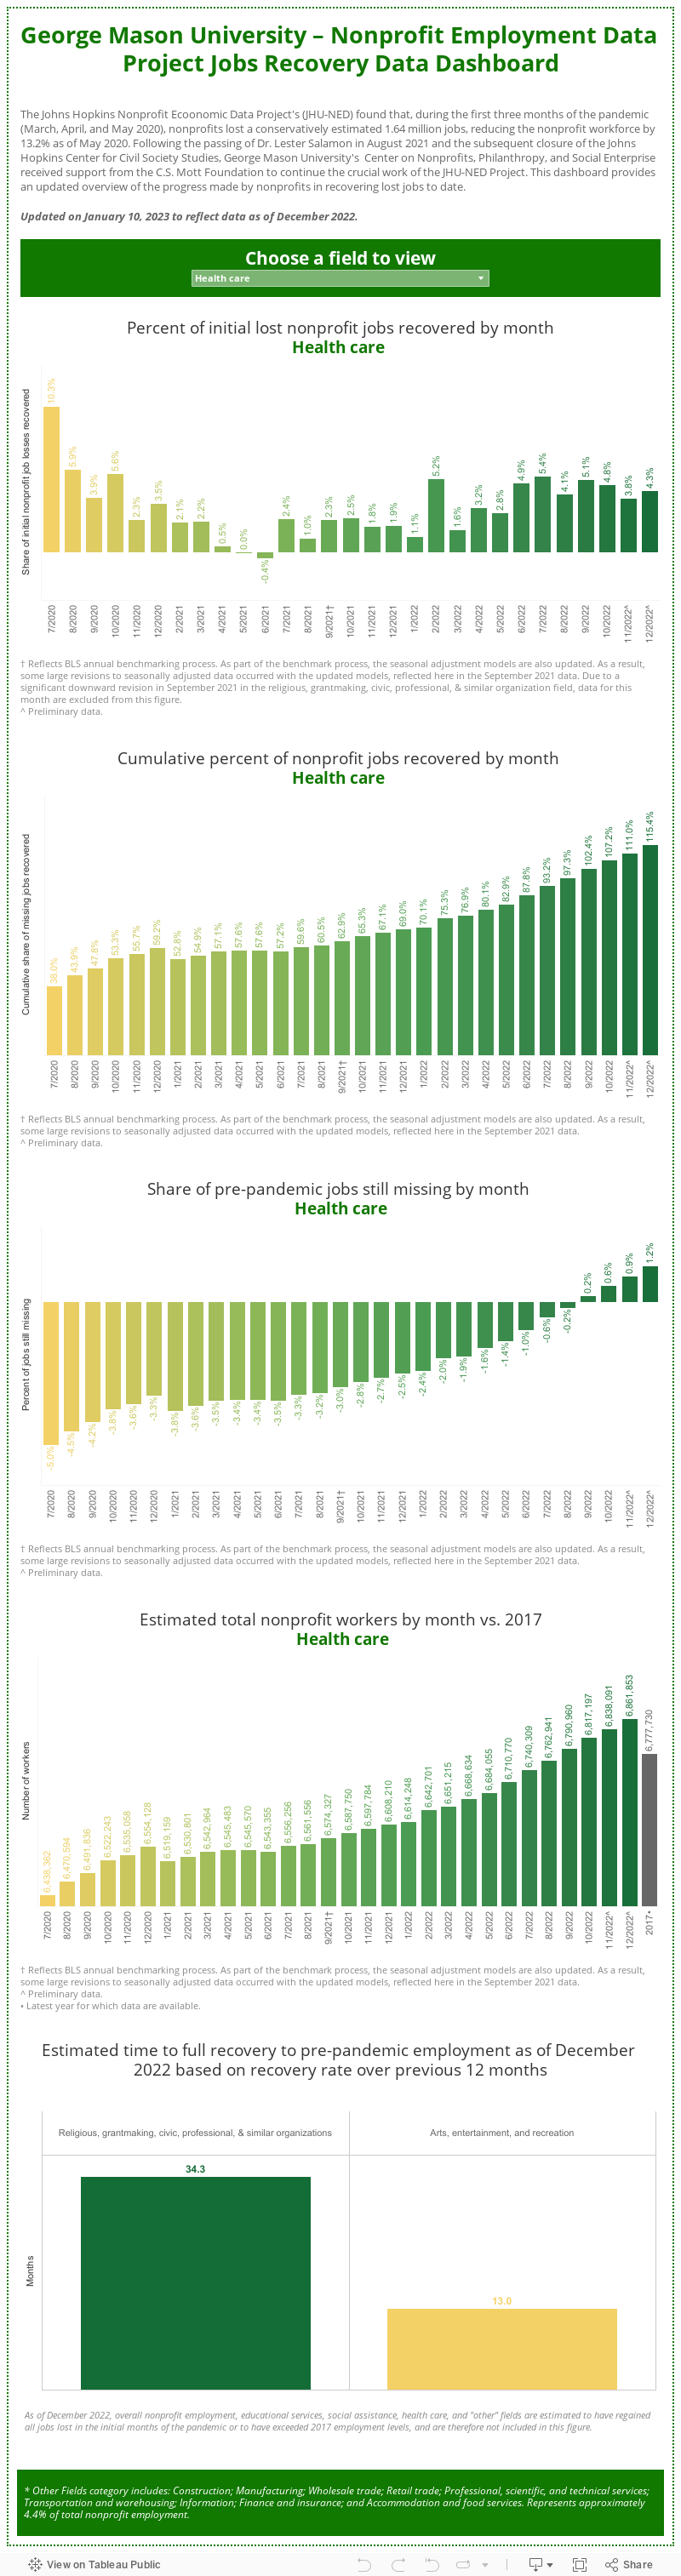
COVID-19 PANDEMIC IMPACT REPORTS. With the onset of the COVID-19 pandemic in early 2020, it became clear that, as was the case with all sectors of the economy, nonprofits faced serious employment impacts. The precise scale of these losses was not apparent, however, because the BLS does not break out nonprofits from other private employers in its monthly employment reports. In an attempt to provide a baseline against which to measure the response of the sector once updated data become available and to surface areas of concern, JHU-NED staff developed estimates of job losses based on the latest available Bureau of Labor Statistics (BLS) data on nonprofit employment by field, which cover 2017. They then applied the reported nonprofit shares of total private employment by field as of that date to the monthly changes in private employment as reported in the monthly BLS Employment Situation Reports. The initial estimates, covering the first 3 months of the pandemic (i.e., March, April, and May 2020), were published in the JHU-NED Project’s final National Report (available here), with an additional 17 monthly updates covering September 2020 through December 2021, which are available here. Following the closure of the JHU Center for Civil Society Studies, the GMU-NED project produced a report and dashboard, which updates these estimates through December 2022. Click here to explore the GMU-NED Jobs Recovery Estimates Dashboard.
The dashboard below provides a quick view of the history of the nonprofit employment recovery process through December 2022.